


Simulmedia TV Marketplace Update For June 19, 2020


Overview
In an effort to keep Simulmedia's clients and partners informed on the latest changes in the linear TV advertising marketplace, we are publishing weekly updates on how TV viewing habits are changing. This report includes TV viewing data through Sunday, June 14.
Below you'll find:
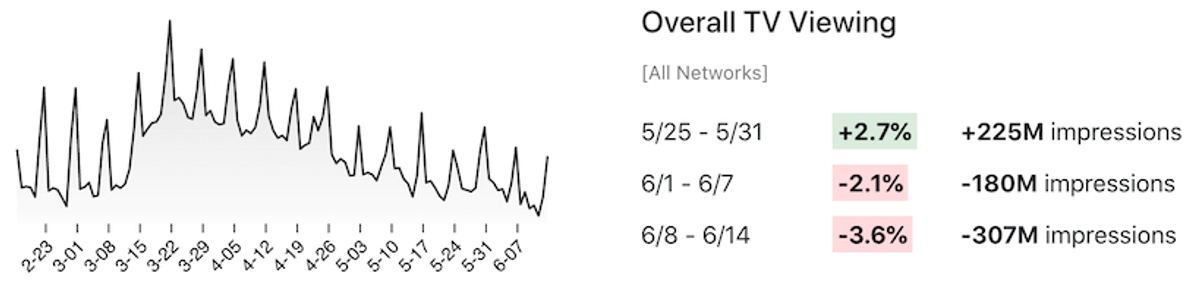
- A visualization showing overall linear TV viewership over time (starting in February).
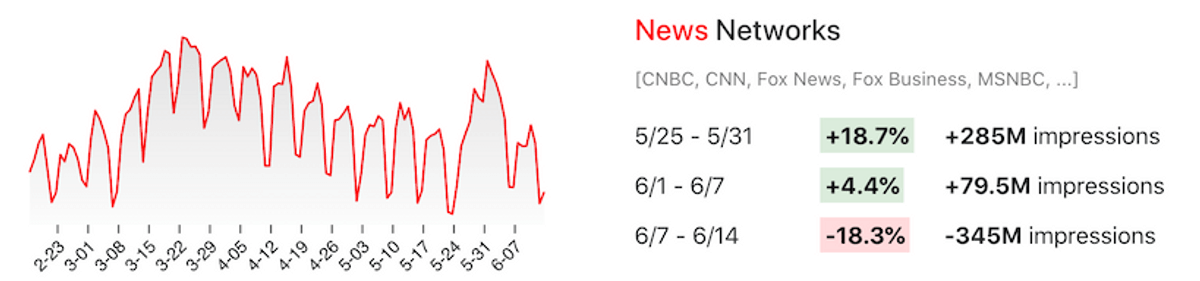
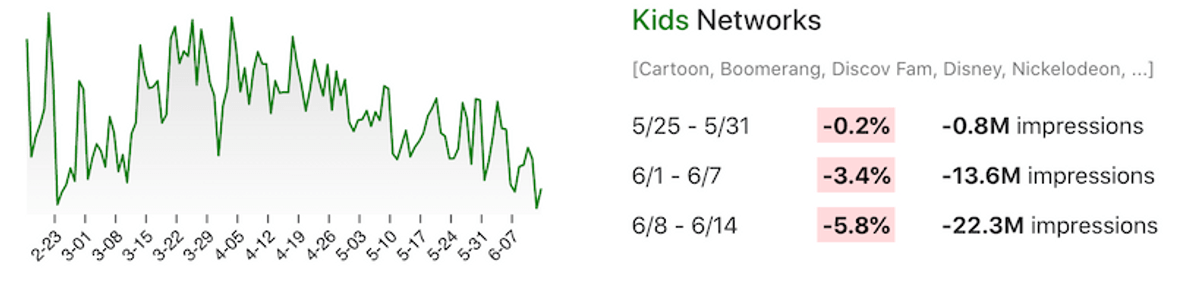
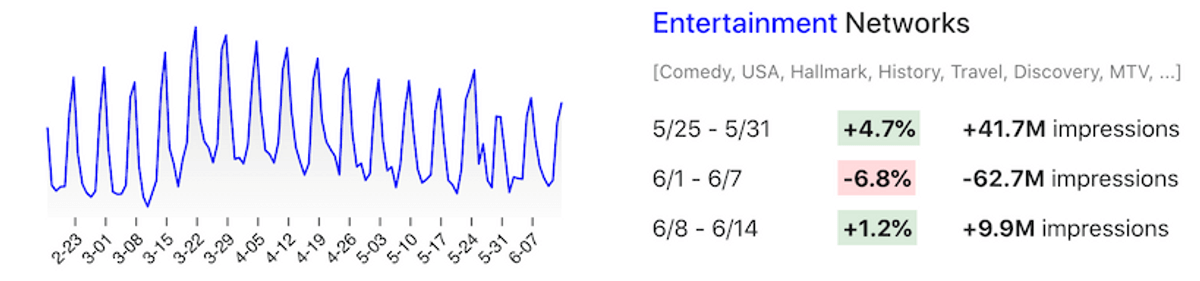
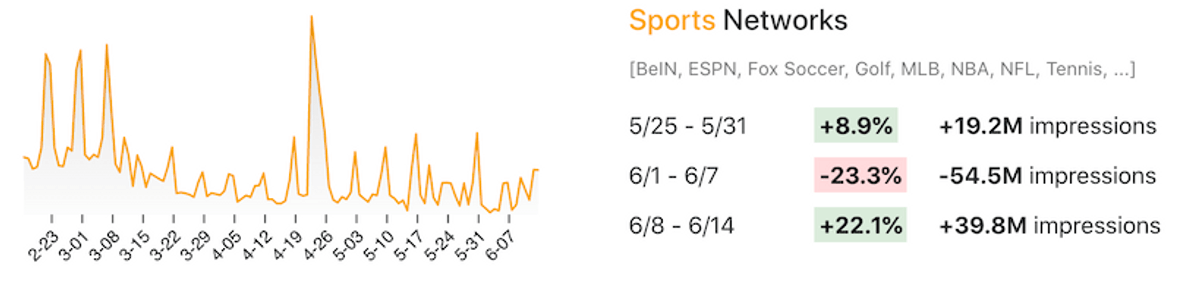
- Week-over-week viewing changes overall and by genre: news, entertainment, kids and sports.
- A closer look at viewing changes at four high profile networks from each of these genres.
- A tool you can use to look at viewing by day over the last week for any network.
Lets get started:


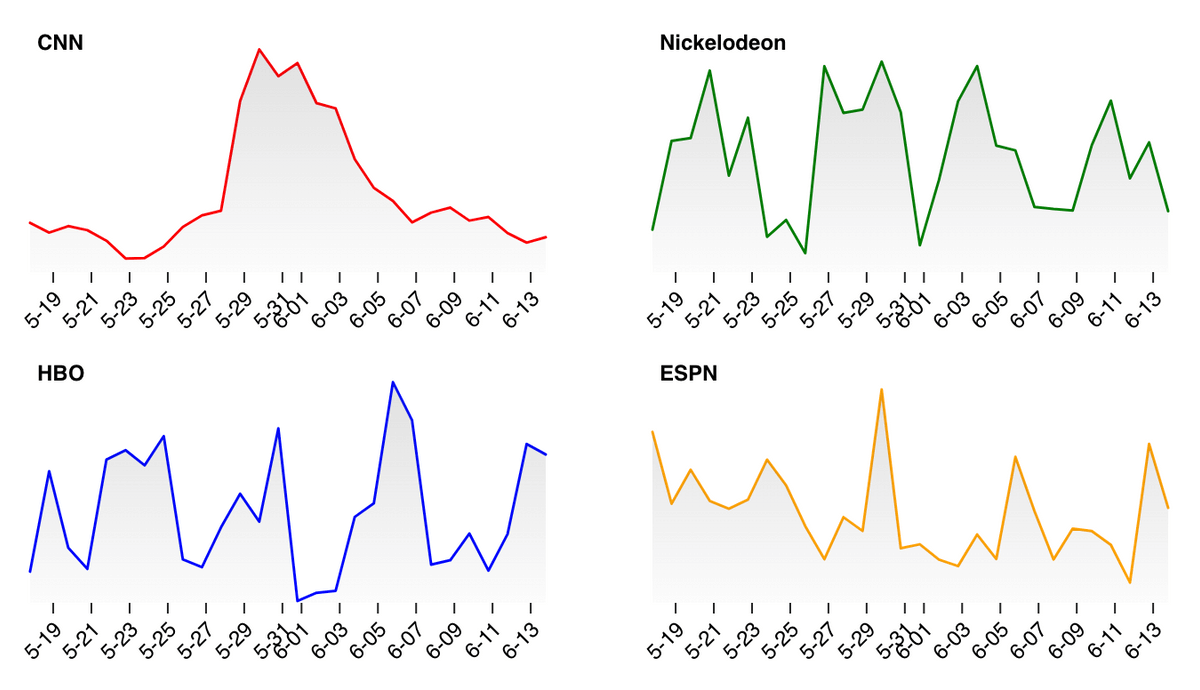
Here are viewing trends at four high-profile networks, one for each of the genres we cover here: CNN (news), Nickelodeon (kids), HBO (entertainment) and ESPN (sports).

Deeper Dive
This drop-down will allow you to summon a chart for every network that shows impressions at the hour level, for four weeks, one week at the time. The darker and stronger the line, the more recent the week: that way, one is able to superimpose and compare the most recent week to the previous ones.
Full Network List
Below you can find a list of all Nielsen rated networks and their week over week trends for the past four weeks. The table contains average daily impressions, as well as week-over-week variations in total impression amounts.
- W1: 5/18 - 5/24
- W2: 5/25 - 5/31
- W3: 6/1 - 6/7
- W4: 6/8 - 6/14
About Simulmedia
We are Simulmedia, a NY-based platform that helps marketers use TV advertising to create more customers. Simulmedia is the only end-to-end TV ad platform that can deliver scaled performance across national linear TV with the speed and precision of digital.
Have Questions?
We’re sifting through changes in TV viewing with the most recent data available and want to make sure you’re getting the answers you need. What did you find most valuable? What other information would you like to see? Email us at marketing@simulmedia.com to let us know how we can make these weekly updates as useful as possible.